EV new-car sales can rise quickly, but the share of EVs actually on Australian roads changes more slowly because petrol and diesel vehicles stay registered for many years.
Electric vehicle adoption is one of those topics where the headline number can be misleading.
If you only look at new sales, the shift can look very fast. If you look at all vehicles already on the road, the shift looks much slower.
Both views are right. They are just measuring different things.
That distinction matters because it changes how we think about the next decade of vehicle change in Australia.
Two EV numbers are worth watching
There are two different EV numbers worth watching.
- EV share of new vehicle sales – this tells us what percentage of people buying a new vehicle are choosing an electric vehicle.
- EV share of vehicles already on the road – this tells us how much of the full registered vehicle fleet has actually changed over.
The first number can move quickly because it reflects current buying decisions.
The second number moves more slowly because Australia already has millions of petrol and diesel vehicles on the road. Those vehicles do not disappear just because new EV sales rise.
What The Driven article argued
An article in The Driven argued that Australia could already be on track to reach around 80 per cent battery electric vehicle new-sales share by 2030. The article used Australian battery electric vehicle sales data from 2010 to 2025 and noted that BEV sales had grown from 10 vehicles in 2010 to 103,269 vehicles in 2025.
The Driven article also reported that BEV market share reached 8.32 per cent in 2025, and that partial 2026 data was already showing stronger momentum.
That does not mean the projection is guaranteed. EV sales can be affected by model availability, pricing, charging access, consumer confidence, government policy, fuel prices and the availability of suitable utes and larger vehicles.
But the direction of travel is still important: new technologies often feel slow until they suddenly become normal.
What our projection shows for new vehicle sales
Using the historical growth pattern from the data and then projecting forward, the new vehicle sales chart shows EVs rising sharply from 2026 onward. In this model, EVs reach 100 per cent of new vehicle sales in 2031.
This should be treated as an extrapolation, not a formal forecast. It shows what happens if the historical growth pattern continues and the result is capped at 100 per cent.
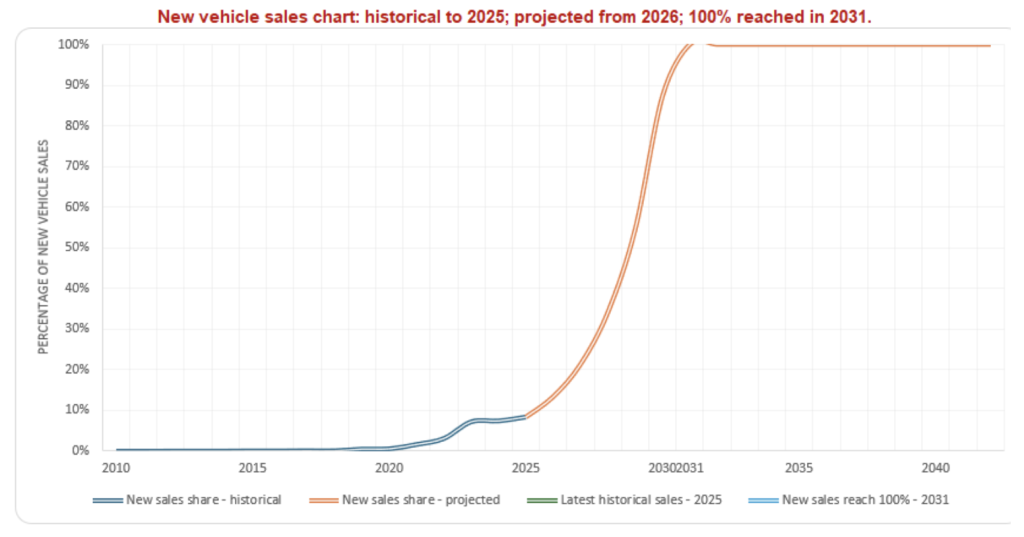
Chart 1 – EVs as a proportion of new vehicle sales, historical to 2025 and projected from 2026.
EV share of new vehicle sales in Australia, with historical data to 2025 and projected growth from 2026 showing the model reaching 100 per cent of new vehicle sales in 2031.
The important point is not the exact year. The important point is the shape of the curve.
Once a new technology moves from early adoption into the mainstream, growth can accelerate faster than many people expect.
But the road fleet changes more slowly
New sales are not the same as the total fleet.
According to the Bureau of Infrastructure and Transport Research Economics, Australia had 22.3 million registered motor vehicles on 31 January 2025. The same release reported about 259,690 registered battery and fuel-cell electric vehicles, including around 249,430 battery and fuel-cell electric passenger cars.
For a simple fleet-share model, the key point is that new EV sales are being added to a very large existing fleet. Even if EVs become the majority of new sales, it still takes time for older petrol and diesel vehicles to leave the road.
That is why the second chart looks very different. In this model, EVs make up only a modest share of the on-road fleet in 2025, then rise steadily as new EV sales compound into the existing vehicle base. The model reaches 100 per cent of the on-road fleet in 2041.
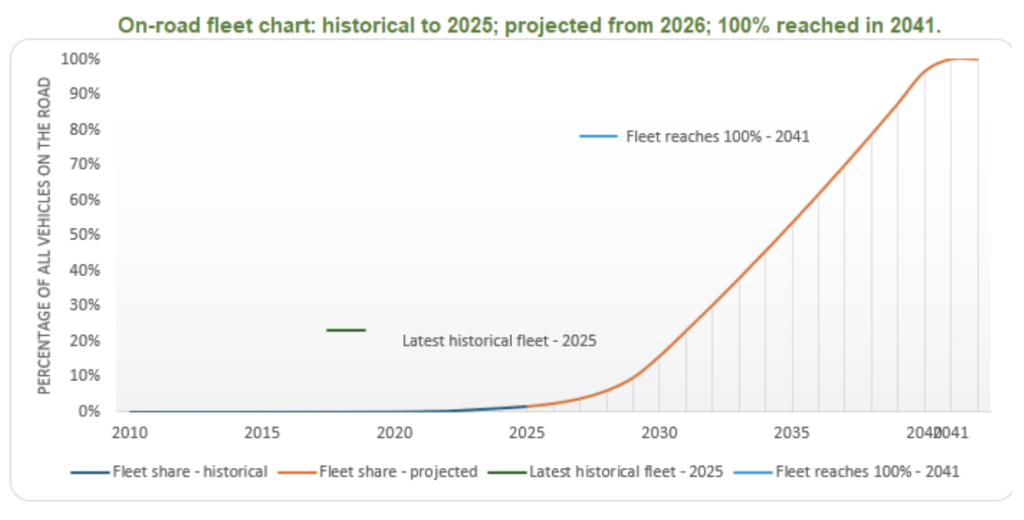
Chart 2 – EVs as a proportion of vehicles on the road, historical to 2025 and projected from 2026.
EV share of all passenger vehicles on the road in Australia, with historical data to 2025 and projected fleet growth from 2026 showing the model reaching 100 per cent in 2041.
Again, the exact year should not be treated as a prediction. The model is deliberately simple. It is useful because it shows the difference between sales adoption and fleet turnover.
New EV sales can change quickly. The road fleet changes more slowly.
But once enough new vehicles are electric, the fleet shift becomes hard to miss.
Why the gap matters
The gap between new sales and on-road fleet share matters for several reasons.
- Car buyers may see more EV choice and sharper pricing before EVs dominate local roads.
- Businesses may need to plan vehicle replacement earlier than they think, even if their current fleet is still mostly petrol or diesel.
- Charging infrastructure may need to grow before the full on-road fleet has changed.
- Resale values may shift as more buyers compare petrol, hybrid and electric options.
- Vehicle finance conversations may start changing before the average street looks mostly electric.
That last point is easy to miss.
A market can change at the new-sales level before everyday roads fully show the change. By the time the streets look different, the buying pattern may already have moved.
The technology adoption pattern is not unusual
The EV transition may feel unusual because cars are expensive, practical and emotional purchases. But the pattern of slow early adoption followed by faster take-up is not unusual.
Personal computers are one example. The Federal Reserve Bank of St Louis noted that computer use in American households started at about 8 per cent in 1984, reached 23 per cent in 1993, and reached around 79 per cent by 2012. By 2022, more than 95 per cent of US households reported owning at least one computing device, including smartphones.
Transport has also seen big transitions before.
New York’s shift from horse transport to motor vehicles is often used as a rough historical comparison. It is not a perfect comparison, and it should not be pushed too far. But it reminds us that once a new transport technology solves enough practical problems, the visible change can arrive faster than many people expect.
The EV transition will not follow the same timetable. Cars cost more than computers. Charging access matters. Many Australians need vehicles that suit long distances, towing, trades, family use and regional driving.
Still, the broader lesson holds: when a new technology becomes practical and affordable enough, adoption can move from “niche” to “normal” faster than expected.
What this means for vehicle finance
This is not just a technology story. It is also a finance story.
If EV new-sales share rises quickly, buyers and businesses may need to think differently about vehicle choice, finance terms, resale value and whole-of-life cost.
For a household, that may mean comparing the purchase price with fuel savings, charging costs, insurance, servicing and expected resale value.
For a business, it may mean looking at fleet replacement timing, tax treatment, charging arrangements, staff use and whether the chosen vehicle fits the work required.
The finance question is not simply: should I buy an EV?
A better question is: does this vehicle make sense for how I actually drive, how long I plan to keep it, and how the market may change during the loan term?
Assumptions used in the projection
This projection is deliberately simple.
It assumes:
- The historical EV sales growth pattern continues forward from 2026.
- Projected EV new sales are capped at 100 per cent once the model reaches that point.
- Each new EV sold adds to the EV fleet.
- Older EVs leaving the road are not separately removed.
- Petrol and diesel scrappage is not modelled directly.
- The total on-road vehicle base is treated as a simple reference point rather than a full fleet turnover model.
That makes this a first-cut model, not a formal forecast.
The cleaner conclusion is not that the exact dates will happen.
The cleaner conclusion is that we need to separate two questions:
- How quickly are new buyers choosing EVs?
- How quickly does that flow through to the vehicles already on the road?
Those are different questions.
The first can move quickly. The second takes longer. But both are now worth watching.
Where I land
The EV debate can easily get stuck in the wrong argument.
Some people look at the current on-road fleet and say EVs are still minor. Others look at new sales and say the shift is already well underway.
Both can be true.
The sales curve tells us where the market may be heading. The fleet curve tells us how long it may take to show up on the road.
On this projection, EVs reach 100 per cent of new vehicle sales much earlier than they reach 100 per cent of the on-road fleet. That gap is the point.
New sales can change quickly.
The road fleet changes more slowly.
But once the new-sales share rises far enough, the fleet shift becomes a matter of time.
For buyers and businesses, the practical message is simple: do not only look at the cars already around you. Look at the buying trend, the finance term, the likely resale market and how quickly the new-sales mix may change.
That is where the EV story becomes less about future hype and more about practical planning.
General information only
This article is general information only. It does not provide tax, legal, financial or credit advice. Vehicle prices, policy settings, tax treatment, charging costs and finance options can change. Before making vehicle or finance decisions, speak with your accountant, tax adviser, broker or other suitably qualified adviser.
Sources and freshness notes
The Driven: Australia could already be on track to reach 80 per cent EV sales by 2030
BITRE: Road vehicles Australia, January 2025
Federal Reserve Bank of St Louis: AI and Productivity Growth: Evidence From Previous Technologies
Freshness check before publishing: re-check 2026 EV sales data, any updates from The Driven, VFACTS/FCAI or BITRE, and any policy changes affecting EV prices or tax treatment.