2026 is only just getting going, and the property and lending world is already moving.
Investors are back in bigger numbers, borrowing rules are tightening from 01 February 2026, and the lower end of the market is getting extra heat — while rents are still under pressure.
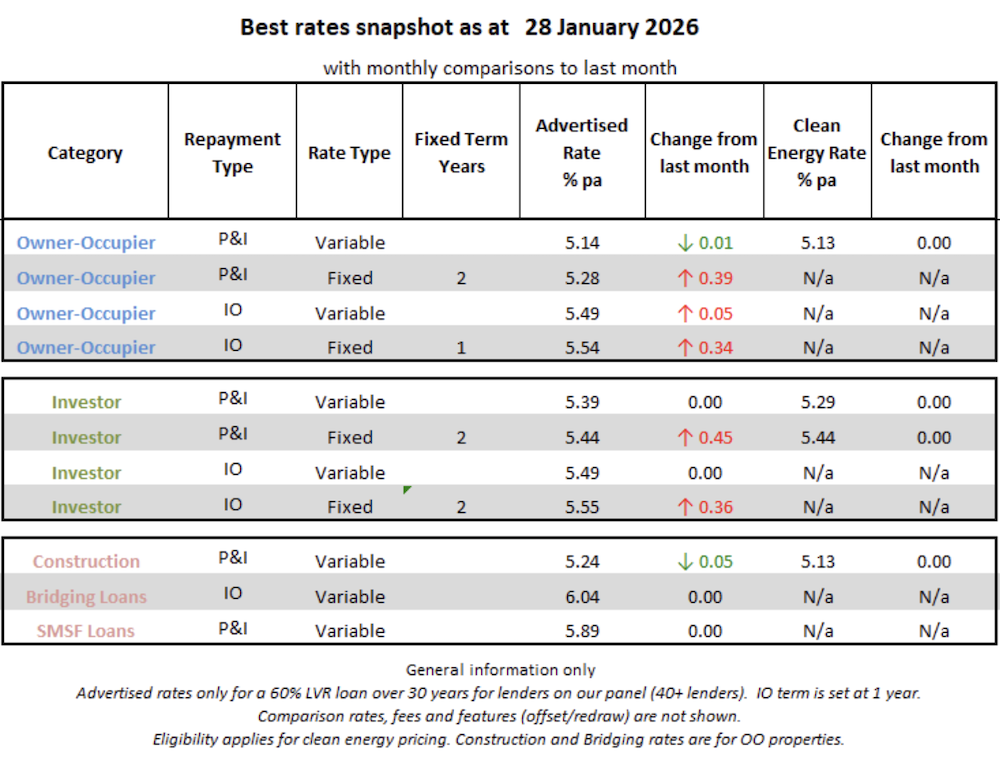
- Best interest rates: as at 28 Jan, and what changed after the RBA move on 3 Feb
- Property and interest rates: When property growth defies “common sense”
- Renovations which add value: and those which don’t
- Investors step back into the market
- Borrowing rules tighten from February
- Why lower-priced homes are pulling ahead
- Rents stay high as supply stays tight
- Superannuation distributions: could your kids really “lose 30% of your super when you die?
- ChatGPT: giving it a dose of steroids
Thought for the day, John Lennon
When I was a kid, my teacher asked me what I wanted to be when I grew up.
I said, ‘Happy.’
She told me I didn’t understand the assignment.
I told her she didn’t understand life.
Scroll down for this month’s stories.

Best Interest Rates
Key comments and observations
- Since 28 January 2026, the RBA has lifted the cash rate by 0.25 percentage points, from 3.60% to 3.85%, following its early‑February meeting (decision announced 3 February, effective 4 February 2026). The key is how each lender passes it on across products and how pricing gaps widen or narrow — not just the headline move.
- IMPORTANT: The timing of the lodgement and assessment of a borrower’s application matters. In practice, lenders assess borrowing power using the rate in place when your application is assessed (plus a servicing buffer). If repricing is due in the coming weeks, borrowing power can shift once the new rate is effective.
- Fixed rates rose this month on our panel, particularly for 1–2 year terms, which typically reflects higher wholesale term funding and hedging costs in the background. Fixed pricing is largely driven by wholesale markets (swaps and bond yields), so when the market price of ‘locking in’ money increases, fixed mortgage rates usually follow.
- That move is about risk management as much as forecasts. Banks can’t easily reprice fixed loans once written, so when uncertainty lifts they reprice to protect margin and manage how much fixed-rate demand they take on. In practice, that means fixed rate changes often reflect banks’ risk appetite and balance‑sheet management as much as their economic forecasts.
- Variable stays competitive because it’s easier to manage. Lenders can sharpen variable pricing to win volume while keeping flexibility to reprice as conditions change.
- Clean energy options appear relatively limited in this snapshot, with a single owner‑occupier variable clean‑energy rate listed and no fixed clean‑energy options currently showing on the panel. That suggests lenders may be keeping these niche offers tight while pricing remains sensitive, although where available the discounts can still be worthwhile.
- Price gaps reflect risk and complexity. On our panel, investor and interest‑only loans sit above comparable owner‑occupier P&I rates, and specialist options like bridging and SMSF loans are priced higher again.

Property and Interest Rates: When property growth defies "common sense"
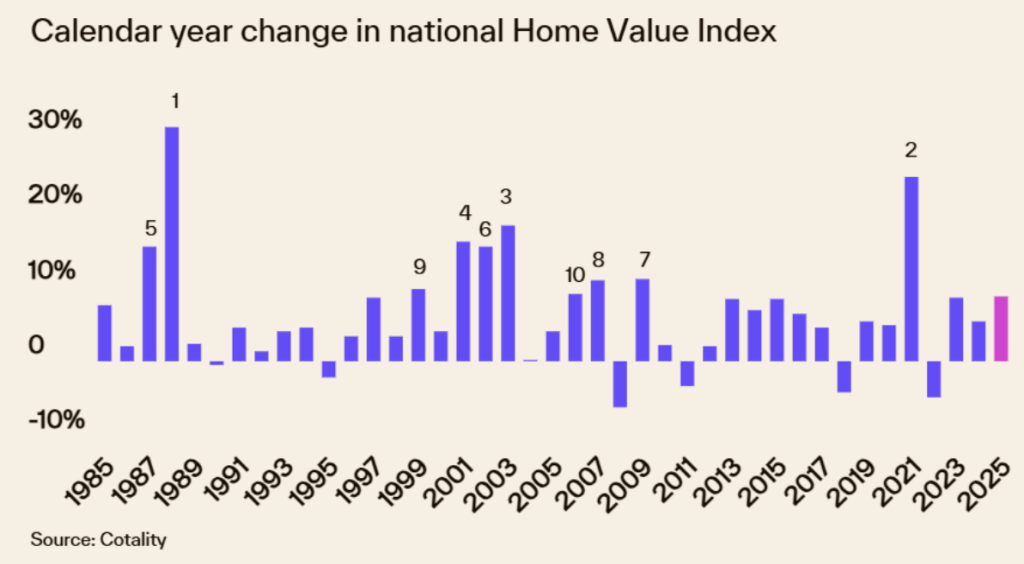
If you’ve ever thought, “Surely prices can’t rise when rates are high”, Cotality’s 40-year lookback is a good reality check.
Cotality’s data shows Australia’s housing market has a habit of doing the “unexpected” — with some of the strongest growth years happening in conditions most people would assume should slow the market.
“Sometimes home values surge when you least expect it.” — Tim Lawless, Research Director, Cotality
The standout years.
Cotality’s top growth years over the past four decades were:
- 1988: +31.2% (with interest rates near 15% and rising)
- 2021: +24.5% (during the pandemic and closed borders)
- 2003: +18.1%
- 2001: +15.9%
- 1987: +15.3%
And 2025 still ranked strongly: Cotality’s Home Value Index rose 8.6% across 2025, making it the 11th highest calendar year gain over the last 40 years.
So what actually drives “surprise” growth?
Cotality’s key point is that housing outcomes aren’t determined by interest rates alone. These forces often matter just as much:
- Fiscal settings and household confidence (how much support or momentum is in the broader economy). The Federal Government’s energy support programs, tax cuts and the expanded first home buyer schemes have and will continue to provide a boost to demand for housing.
- Credit availability (bank policy, serviceability settings, risk appetite). The expansion and changes to the First Home Buyer Scheme were too late to influence these historical results, but they will add to the mix for future years’ property price growth.
- Migration and population growth (extra demand for homes and rentals) – is now normalising following Covid but the rush back to Australia post-Covid has had ongoing impacts on demand for housing.
- Supply constraints (listings, construction capacity and completions). This has been a major issue post-Covid and whilst it is normalising, it has still had a strong impact over recent years.
- Shocks (global crises, policy changes, sudden shifts in sentiment).
That mix helps explain why two years with totally different backdrops (1988 and 2021) could both deliver extraordinary growth.
A helpful “calm down” stat
Cotality also notes that over the past 40 years there have been only six periods where home values fell. That doesn’t mean prices can’t fall — it just shows downturns have been less common than people expect.
What this means for 2026 thinking
Cotality’s early view is that 2026 could be a softer landing after a strong 2025, with affordability and rate uncertainty weighing on momentum.
At the same time, policy settings still matter — for example, APRA has kept the mortgage serviceability buffer at 3%, and has said it hasn’t been “restrictive” overall, which helps explain why credit hasn’t suddenly collapsed.
The practical takeaway
If you’re making a property decision, the lesson isn’t “ignore rates”. It’s this:
- Rates matter — but they’re only one lever. The market is often moved by the bigger bundle: supply, credit policy, migration, and confidence.
If you want a simple, sensible next step, focus on what you can control:
- Your borrowing buffer (how comfortable repayments feel, not just whether you can get approved).
- Your holding costs (especially if you’re an investor).
- Your time horizon (short-term noise matters less if you’re holding long-term)
Like to do a sanity check on your next property decision?

Renovations That Don't Add Value and Those Which Don't
An article from realestate.com.au on renovations prompted my thinking. I thought I would expand on what it said by doing some additional research. Based on the steps below, I have created a checklist (if you are interested, please email me).
The first rule when considering renovations
If you’re renovating to increase sale price (or protect value), the safest rule is the one agents repeat:
If it ain’t broke, don’t fix it.
In other words, don’t spend money replacing things that buyers won’t value — or worse, that buyers will see as “your taste” rather than an upgrade.
This matters even more when building costs and labour remain volatile, as it’s easier to overcapitalise (spend $X and only recover $Y at sale).
Additionally, if you own an investment property, you need to consider not only the property’s improved value but also its impact on rental returns and rentability.
Step 1: Start with the “overcapitalising” test
Overcapitalising occurs when renovation costs exceed the value it adds.
Use this simple pre-reno checklist:
- Define The Buyer: Who buys in your street (first home buyers, upsizers, investors)?
- Price Ceiling Check: What’s the upper end of recent comparable sales nearby?
- Fix Vs Fancy: Spend first on defects and liveability, not luxury finishes.
- Budget Guardrail: Set a budget before you get quotes and stick to it (your local agent or a vendor advocate can help sanity-check what buyers will actually pay for).
Step 2: Renovations that usually add value (because buyers feel them)
Cotality and major property sites consistently point to the same areas: kitchens, bathrooms and outdoor appeal, because they affect daily living and buyer emotion.
Most common “worth it” upgrades include:
- Kitchens: Not always a full rip-out; often better value is a clean, functional, modern, and neutral design.
- Bathrooms: Fresh, clean, and low-maintenance wins (tapware, screens, regrouting, and lighting can help if a full reno isn’t justified).
- Street Appeal: Landscaping, front entry, paint, fencing, lighting — small things that help buyers feel confident before they even walk in.
- Energy Upgrades: Solar and efficiency features can enhance appeal for buyers focused on running costs (and can strengthen your sales story if executed neatly).
Step 3: Renovations that can devalue (or reduce your buyer pool)
The realestate.com.au piece is blunt: don’t add things that won’t bring value, and avoid changes that make buyers think “I’ll have to undo that”.
Common “devalue” patterns are:
- Replacing functional items for no gain: Example: swapping quality windows that already look good, just because it’s a “project”.
- Hyper-personal choices: Bold statement renovations can turn buyers away because they feel like extra work (and cost) to reverse.
- Over-spec for the area: Premium finishes in a market that won’t pay a premium (classic overcapitalising).
- Big layout changes without broad appeal: If it suits you but confuses the average buyer, you can lose competition on auction day.
Step 4: The “Goldilocks” renovation plan (copy/paste)
If your goal is value (not a dream build), use this sequence:
- Repair First: Fix obvious defects (cracks, leaks, damp, safety, broken fixtures).
- Clean And Light: Paint, declutter, deep clean, lighting — low cost, high impact.
- Modernise Key Rooms: Kitchen/bathroom refresh only to the level your suburb will pay for.
- Lift The Outside: Front yard, entry, and the first 10 seconds of the inspection.
- Stop Before Luxury: If your quotes push you beyond local sale ceilings, pause and reassess (that’s where overcapitalising lives).
Who can help you avoid expensive mistakes
A good local agent (or a vendor advocate) can often tell you quickly what buyers in your pocket are actually paying for — and what they’re ignoring.
In addition to vendor advocates, I have access to high-quality home renovation specialists, particularly in Melbourne. One person I recommend is Yanal Shyamji of Triple Zero Constructions. Yanal has worked with many people I know, and he has solved many a problem in my home (plus he has an excellent network of specialist tradies like tilers – you may recall I mentioned my tiler, Milan Gala, in an article on tiling mistakes property owners make). As a trained engineer, Yanal approaches problem-solving differently from a typical repairer.
Let me know if you would like a chat with Yanal. He’s a nice guy.

Solar + Battery: Solutions which might surprise you
Jatin Bhalani from 85 Energy is a friend of mine. He quotes and installs solar and batteries for homes and offices.
We will be assisting his clients in looking for finance solutions as part of his solar and battery installation program. He primarily operates in Victoria but also has Australia-wide connections.
Last year, when the new Federal Government incentives were released, Jatin provided me with a quote for a solar and battery installation. It took me a while to address it, so I missed the first wave of incentives. Anyhow, I am now ready to act (I told him)!
When he gave me an updated quote, the numbers surprised me. Whilst these are relevant for my home, they are a good reference point for your consideration.
Option A: What we need for our home needs – 24.96kWh battery → Net cost $16,990
Option B: The best financial plan with the option of feeding back into the grid with revenue benefits – 49.92kWh battery (about double the storage) → Net cost $13,746
So: double the battery, but $3,244 less in out-of-pocket costs.
Why would a bigger battery cost less?
A big driver in quotes like this can be Small-scale Technology Certificates (STCs).
STCs are government-backed certificates under the Small-scale Renewable Energy Scheme. Installers can apply their value as an up-front discount on eligible systems.
One practical catch to understand: the Clean Energy Regulator notes only one solar battery system at a premises is eligible for STCs, and a used battery reinstalled at a new premises is not eligible for STCs.
That’s why “I’ll just start small and add more later” can be less attractive than it sounds.
In these two quotes, the big swing is the battery STC discount:
24.96kWh option: 223 Battery STCs (discount $8,251)
49.92kWh option: 403 Battery STCs (discount $14,911)
That’s a $6,660 larger discount on the bigger battery option, which more than explains why the larger storage can end up cheaper overall.
If the smaller battery already meets your needs, what can you do with the bigger one?
Option 1: Electrify more of the home (move away from gas)
If you have more storage than you need today, the most efficient use is to shift more energy use into electricity, so your solar + battery can cover it.
Common upgrades people consider:
- Heat pump hot water (often the biggest bang-for-buck)
- Induction cooking
- Reverse-cycle heating/cooling (instead of gas heating)
Are there incentives in Victoria? Yes:
- The Victorian Energy Upgrades (VEU) program supports discounts for upgrades like heat pump hot water, reverse cycle heating, and induction cooktops.
- Solar Victoria offers a hot water rebate up to $1,000, or up to $1,400 for eligible locally made products.
- Solar Victoria also maintains product lists and eligibility criteria (useful to check before you commit).
Why this matters: extra battery capacity is most valuable when it helps you avoid buying grid electricity in the evenings (rather than exporting solar for a low credit).
Option 2: Use it to dodge peak pricing
Even if your usage doesn’t change much, a larger battery can help you “time shift”:
- Charge during solar hours
- Run the home when grid pricing is higher (depending on your tariff)
This tends to beat exporting, because export credits can be low and variable.
Option 3: Export to the grid (possible, but usually not the main value play)
Yes, you can export surplus solar/battery energy — but the economics are often lower than people expect.
In Victoria, the Essential Services Commission notes there is no longer a minimum feed-in tariff from 01 July 2025 — retailers set their own feed-in tariffs (not below $0.00).
The Victorian Government also notes that retailers have greater flexibility to set solar feed-in tariffs (from 01 July 2025).
Practical takeaway: treat export as a bonus, not the core reason to oversize your battery.
Option 4: Plan for an EV (electric vehicle)
If an EV is likely in the next few years, extra battery capacity can be a real advantage because it can help you:
- Charge your EV overnight using stored solar
- Reduce reliance on grid charging (especially evenings)
This is the most common “future-proofing” reason households go larger.
Option 5: Backup power (if it’s configured for it)
Some people want a bigger battery for blackout resilience. That can be worthwhile — but only if the system is actually configured for backup.
Not all battery installs automatically provide blackout backup. Make sure this is confirmed in writing (see questions below).
The “two-way vs one-way” EV question (important)
A home battery system is two-way: it charges and discharges to supply your home.
But EV-to-home (V2H) / EV-to-grid (V2G) are different: they require a compatible EV and a bidirectional charger, and not all chargers support them. In Australia,
So the right way to frame it is:
- Battery → Home: yes (normal operation)
- Home → EV charging: yes (with a standard EV charger)
- EV → Home/Battery (V2H/V2G): needs specific hardware and compatibility
Find out more?
If you want to learn more, I can introduce you to Jatin to get a quote and review the options. Or, if it is simpler, you can ring 1300 13 13 85
If you’d like to explore financing options, I can run the numbers for you. There are several financing options for your solar + battery, including home loan add-ons, green or solar loans, and personal loans and credit cards. With this information, you can determine what’s the best value for you.

Renovations That Don't Add Value and Those Which Don't
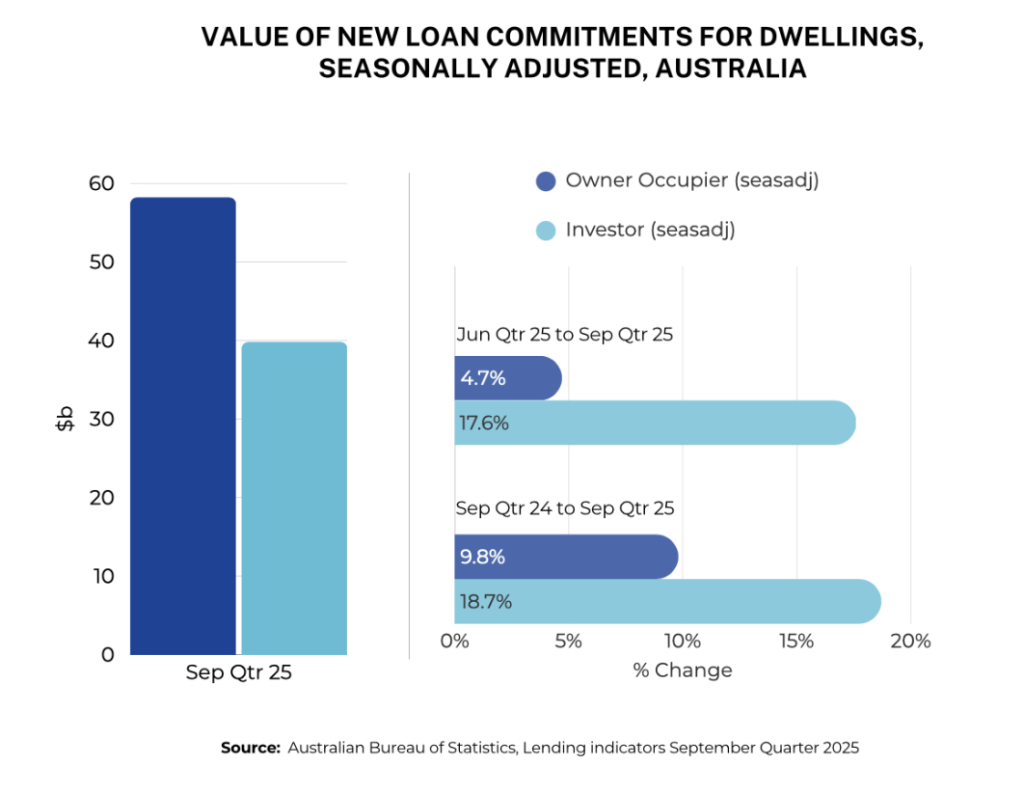
Investor lending lifted strongly into the September quarter 2025, and it was a key driver of the broader housing finance upswing.
The ABS reported 57,624 new investment loans in the September quarter (up 13.6%), with the value rising to $39.8bn (up 17.6%), which works out to about $685K per loan. The next ABS lending data for the December quarter will be issued around 11 February.
What’s driving it?
A familiar mix: prices have been rising, rents have been rising, and investors are doing what investors do — they follow the numbers.
“The number of investment loans has increased since March 2023… reaching around 40 per cent of the total of new loans.”
Update since the ABS quarter (Oct–Dec 2025 into Jan 2026)
The “investors are back” story didn’t disappear after September — but the market tone did start to shift late in 2025.
Cotality’s Home Value Index shows 2025 delivered strong gains (+8.6%), but it also points to a softer landing in 2026 as affordability and interest-rate expectations bite.
On the credit side, the RBA that housing prices and housing credit had picked up, with the increase most notable in investor credit. In its November 2025 Statement on Monetary Policy, the RBA also said investor credit growth had lifted to its highest rate since 2015.
What this means
The takeaway isn’t just headline returns. What determines whether an investment feels manageable month to month is the loan setup — repayments, buffers, and flexibility — especially if the market cools while credit conditions become more selective.
This is where investor outcomes can split. Two buyers may purchase similar properties but end up with very different cash flow depending on lender policy and loan structure.
If you’d like a quick sense-check: I can model your numbers and show you a couple of realistic pathways (not just a rate).

New Lending Limits Arrive From February
From 01 February 2026, APRA will activate a debt-to-income (DTI) lending limit for residential mortgages issued by banks and other authorised deposit-taking institutions (ADIs). Under the rule, ADIs can write up to 20% of new owner-occupied loans and 20% of new investor loans where the borrower’s total debt is six times income or higher.
Importantly, however, APRA’s DTI limit excludes owner-occupier bridging loans and loans for the purchase or construction of new dwellings, to avoid disrupting normal transactions and new housing supply incentives.
Readers should note: This DTI cap is a cap on banks’ total high‑DTI lending, not a hard rule that no borrower can exceed six times income.
Why DTI matters, given servicing already limits borrowing
In practice, the main constraint on most borrowers is still serviceability (income, living costs, existing debts, and the lender’s assessment rate). DTI is different: it’s a simple ratio that regulators and lenders use to identify situations where a borrower may be stretched, even if they technically “pass” servicing on paper.
Put simply, serviceability answers: Can you afford the repayments under the lender’s assumptions? DTI adds: How large is your total debt relative to income, and what happens if things go wrong?
Examples
#1 Passes servicing, still high DTI
A couple on a strong income might still pass servicing — even with the buffer — because their living costs and other debts are low. But if the loan is very large relative to income (say 6x+), the risk is that a job change, parental leave, vacancy (for an investor), or a future rate rise can hurt faster. That’s why DTI is treated as an extra “stretch” flag, not a replacement for servicing.
#2 DTI looks fine, servicing fails
Another borrower might have a moderate DTI on paper (well under 6x) but still fail servicing because they have high living costs, multiple debts (credit cards, car loans), or dependants. In that case, DTI isn’t the issue — servicing is.
Why “six times income” became a bigger issue post-COVID
When interest rates were very low after COVID, borrowers could often service a larger loan because the assessed repayment amount (even after applying a buffer) was still relatively low. That environment pushed more borrowers into higher DTIs.
In response, APRA increased the minimum serviceability buffer it expects banks to use from 2.5% to 3.0% in October 2021, specifically to reduce maximum borrowing capacity and build resilience while rates were unusually low.
APRA noted at the time that “more than one in five” new loans in the June quarter (2021) were at more than six times income, which shows how common high DTI lending can become when money is cheap.
How lenders tend to treat DTI in the real world
Across the major banks, a DTI of around 6 is often treated as a practical threshold: sometimes it can be approved, sometimes it can’t, and it often depends on the overall risk picture (deposit size, stability of income, existing debts, dependants, and the property).
Outside the ADI world, some specialist and non-bank lenders may take a different view and may accept higher DTIs or place less weight on the metric. The trade-off is usually in pricing, terms, or other policy settings.
What we’re seeing right now (practical outcome)
At current interest rates, we (BIR Finance) are not seeing many normal household scenarios where DTI pushes above 6, because serviceability tends to cap borrowing before that ratio gets extreme.
So this change by APRA is likely doing two things:
First, it keeps a small group of very highly leveraged borrowers out of the mainstream bank market.
Second, it sends a signal. Even when a rule doesn’t bite widely, raising it tends to increase caution. That can act as a brake on “maximum stretch” behaviour, especially if rates fall again and borrowing power lifts.
APRA has also been clear that it is acting early, because risks can build quickly when rates are low or falling and competition for new lending intensifies.
If you’re buying or refinancing this year, I can help you understand how the new limits apply to your situation and compare lenders before the changes take effect.

Smaller Deposits Are Reshaping Buyer Demand
One of the more interesting shifts right now is where buyers are competing — and government policy, as implemented by Housing Australia, is part of the reason.
This is one of those market moments where two things can be true at the same time:
- A policy change can make it easier for first-home buyers to get in.
- And that same change can add demand pressure in a market where supply is still constrained.
Who is Housing Australia, and what is the 5% Deposit Scheme?
Housing Australia is the Australian Government’s independent national housing agency. It helps deliver housing programs, including the Home Guarantee Scheme.
The “5% Deposit Scheme” is a common shorthand for the government guarantee that can allow eligible buyers to purchase with a deposit as low as 5% and avoid Lenders Mortgage Insurance (LMI). It’s still a normal home loan with a participating lender, subject to eligibility rules and property price caps.
A quick definition: Property price caps are the maximum purchase price allowed under the scheme, and they vary by location.
What changed in late 2025
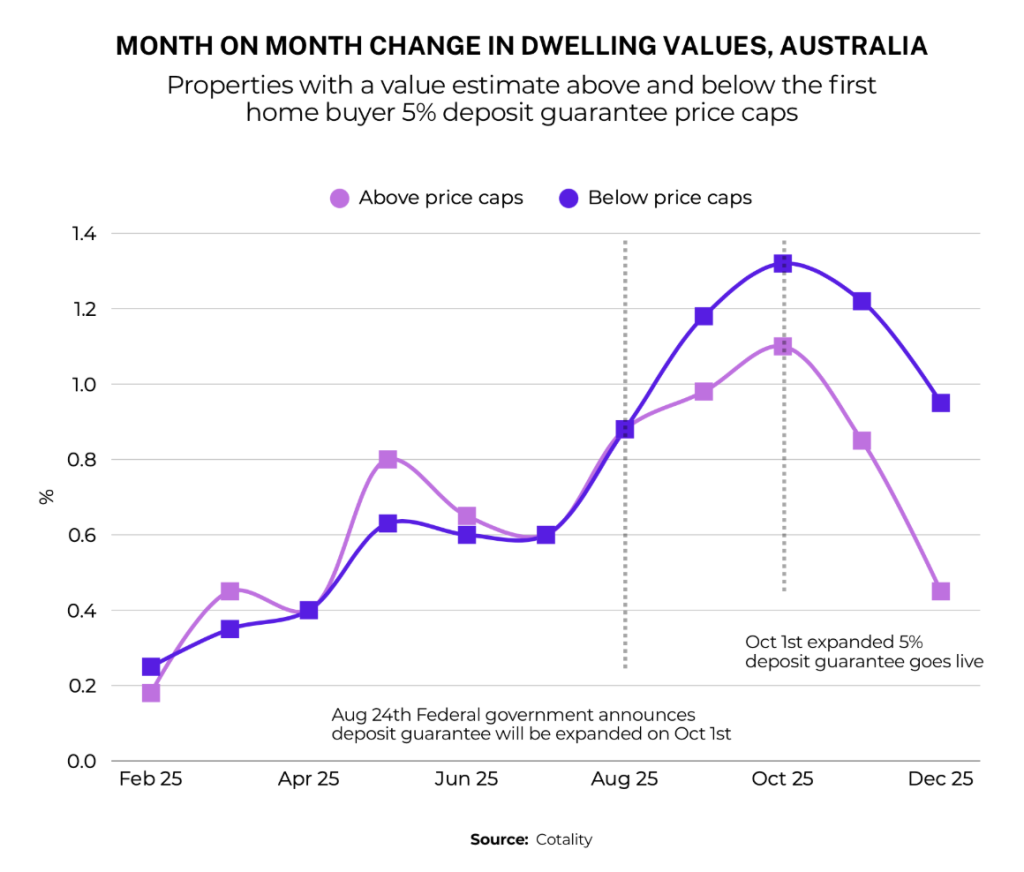
Before October 2025, the scheme was more restricted, so fewer buyers and fewer properties qualified. From 01 October 2025, Housing Australia expanded the program to unlimited places, higher property price caps, and no income caps (under the relevant settings). That change widens access, which can increase competition in price ranges under the caps.
What the market data is showing
Cotality’s analysis suggests demand has sharpened at lower price points. In the December quarter 2025, homes valued below the scheme price caps rose 3.6%, compared with 2.4% for homes above the caps.
Demand policy meets supply reality
The policy’s aim is understandable: help more first-home buyers access a deposit pathway.
The harder question is what happens when demand is boosted while supply is still slow (and sometimes risky) to deliver.
Australia has a national target of 1.2 million new homes over five years from 01 July 2024 under the National Housing Accord.
But the build pipeline runs into real constraints: skills shortages, project competition, planning delays, and cost pressure. ABC reporting has noted that builders are seeing approvals and sales lift, yet still cite skilled labour shortages and delays as practical brakes on delivery.
Update: the “unexpected” part — insolvencies and the human cost
There’s another layer that doesn’t get enough airtime: financial stress inside the building sector can reduce supply and hurt people at the same time.
On insolvencies, ASIC publishes corporate insolvency statistics and explains these are updated regularly (including “first time a company enters external administration”).
Recent reporting and market indicators show construction has remained one of the most stressed sectors, with insolvency levels elevated compared with pre-pandemic norms.
When builders go under, the supply impact is not theoretical:
- Projects can stall or slow.
- Subcontractors can be left chasing payments.
- New commencements can be delayed as confidence drops.
Then there’s the human side. Construction workers have a higher suicide risk than other working men, with research commonly cited around an age-standardised rate in the mid-20s per 100,000 and roughly double that of comparable groups. And in the background, support services are reporting strong demand for help from tradies, particularly around shutdown periods and financial pressure.
In short, if we increase buyer demand while the build sector is under capacity, cost and solvency stress, the result can be higher competition for existing homes and a slower supply response.
Update: broader price momentum is cooling, but the “under-cap” segment can still run hot
Even with strong annual results, the broader market slowed into late 2025. PropTrack expects 2026 growth to be slower than 2025, with affordability and rate expectations shaping momentum.
So it’s possible for the overall market to cool while the under-cap segment remains more competitive.
What all this means
If you’re using the scheme, the biggest risk isn’t the scheme itself. It’s overpaying in a hotter price band because more buyers are now concentrated in the same segment.
A sensible approach is:
- Set a price guardrail before you start inspecting seriously.
- Get a proper pre-approval strategy, not just a number.
- Stress-test repayments so you can hold the loan comfortably if life changes.
If you’re considering a purchase under the scheme, I can help you check eligibility, lender participation and what the numbers look like beyond settlement.
If you or someone you know in the building trades is doing it tough, support is available. In an emergency call 000. Or, contact Lifeline 13 11 14 or Beyond Blue 1300 22 4636.

Rental Pressure Remains A Key Market Force
Australia’s rental story is no longer just “rents up, vacancies down”. It’s turning into a more complex mix of tight supply, affordability ceilings, and a flow-on effect into inflation (and therefore interest-rate settings).
What the latest data is saying
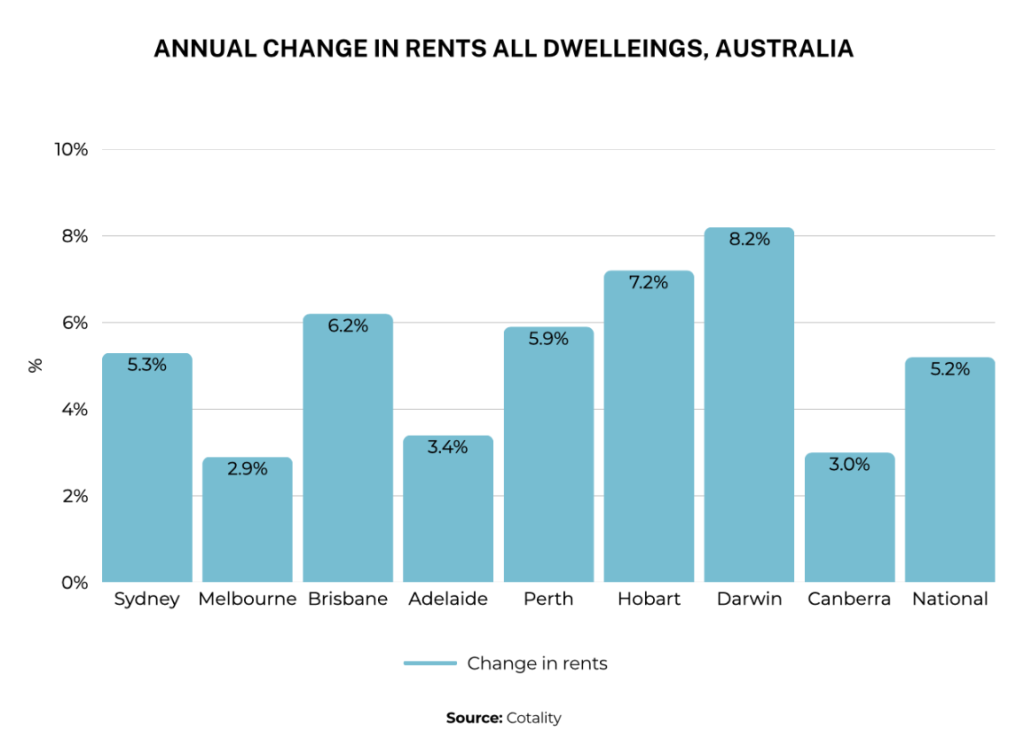
Cotality’s January 2026 rental review shows rents lifted again through the December quarter 2025: national rents were up 1.3% for the quarter and 5.2% across 2025. Cotality also reported national median rent at $681 per week, vacancy at 1.7%, and rental listings down 11% year-on-year (and 17% below the five-year average).
SQM’s vacancy data gives a similar message with a slightly different lens: the national vacancy rate rose to 1.4% in December 2025 (from 1.3% in November) and SQM described this as a typical seasonal lift, while still noting conditions remain tight relative to longer-run norms.
Update: what’s changed since the “red-hot” phase
Domain’s December 2025 Rental Report points to a market that is still tight, but starting to hit an affordability cap. Domain notes competition remains strong and rents are elevated, but affordability is increasingly limiting “how far and how fast” rents can rise.
Domain’s numbers also show that momentum is uneven across dwelling types: in the December quarter, combined capital city house rents rose 2.3% while unit rents were flat (nationally, for that quarter).
That matters because it can push households toward smaller or shared accommodation, which eases pressure in some parts of the market while still leaving overall conditions tight.
Real-life examples:
#1 The renter
A renter household gets hit with a renewal increase they can’t absorb. Rather than keep stretching, they move from a house to a unit, or they add a housemate.
The result is demand shifts around the market — not always “less demand”, just different demand — and it can keep pressure on the more affordable rental options.
#2 The investor
An investor sees rents rising and assumes cash flow will automatically improve. But insurance, strata, maintenance and interest costs can rise too. If tenants are already near their limit, the investor may not be able to lift rent enough to offset costs — and if the property sits vacant for even a few extra weeks between tenants, the numbers can swing quickly.
That’s why buffers and loan structure still matter.
The “unexpected” piece: rents feed inflation, and inflation feeds rates
Rental costs are not just a housing issue; they’re also part of the inflation picture.
The ABS reported the Housing group was a major contributor to annual inflation in the CPI to November 2025.
The RBA has also flagged that advertised rent strength tends to pass through into the CPI measure of rents over time (because CPI reflects the rents currently being paid, not just new asking rents).
Why this matters: if rent inflation stays sticky, it can keep broader inflation higher for longer, which can affect the timing of rate cuts (or keep borrowing costs higher than people expect). That then feeds back into household budgets and investor decisions.
What this means for renters and investors
There are trade-offs when supply is tight, and costs are high.
For renters, the risk isn’t only today’s rent — it’s the renewal cycle and the lack of choice when vacancies are low.
For investors, the story isn’t only higher rents. It’s whether the property produces a comfortable, repeatable cash flow after higher interest costs, insurance, strata and maintenance. When affordability caps are reached, it can become harder to “push through” large rent increases, even if demand is strong.
Practical takeaways
- Separate advertised rents from CPI rents. Advertised rents can move first; CPI rents typically lag.
- Watch vacancies and listings, not just rent headlines. Low vacancies and low listings usually mean competition stays high.
- Expect uneven conditions. Some cities or dwelling types can stall while others keep rising.
- Treat affordability as a ceiling. Domain’s point is important: rents can stay high, but growth can slow when tenants simply can’t pay more.

Superannuation Distributions: Could your kids really lose 30% of your Super when you die?
Super can be a complicated beast. And, I would hazard a guess that most of us don’t know how distributions from a super fund are taxed, particularly when the super fund member dies.
To highlight the uncertainty of this, I recently read an article in the online mainstream media, (Yahoo Finance) that set off alarm bells for me on this topic
The headline said that adult children could lose “up to 30%” (or “32%”) of their super inheritance from their mum or dad because of “little-known tax rules”. That sounded scary!
So, I asked a good friend of mine, Andrew Bonnici, Endgame Advice, a financial planner, for his take on the article. His take? There is a truth inside that headline — but the real outcome depends on who receives the benefit and what your super is made of.
In many everyday cases, however, the scariest version of the headline is overstated.
We have set out below some of the main issues you can consider and then apply them to your situation. However, always seek the advice of a professional financial planner as everyone’s situation differs.
Words matter: the details behind the headline
Step 1: Who receives your super matters
Super death benefits are treated differently depending on whether the recipient is a tax dependant – or not.
Tax dependants can include:
- A spouse (including some former spouses in certain circumstances)
- A child under 18
- Someone financially dependent on you, the member
- Someone in an interdependent relationship
Non-tax dependants are commonly adult children who are not financially dependent on you, the member.
Step 2: What gets taxed (and what doesn’t)
Super is generally split into two components which become relevant when a death benefit is to be paid out.
- Tax-free component (generally not taxed).
- Taxable component (may be taxed, depending on who receives it).
The media’s “up to 30%” headline relates to tax that can apply to the taxable component when a death benefit is paid to a non-tax dependant (such as many adult children).
The “clickbait” angle: the 30% rate is not always common
The highest “30%” style tax outcome is mainly linked to cases where there is a taxable untaxed element in the death benefit.
Practical examples
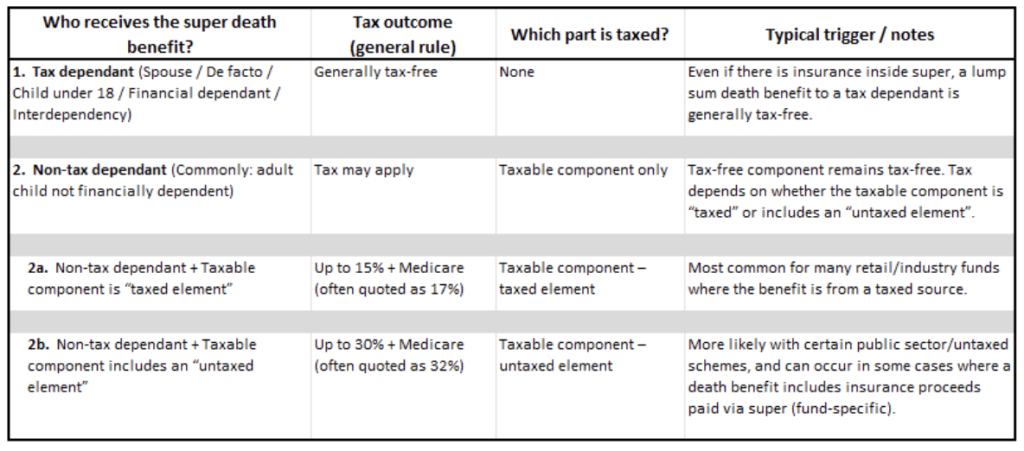
1. Distributions to a Tax Dependant (see table above):
– Outcome: generally, tax-free if received as a lump sum.
– Common examples:
#1 A couple where one partner dies and super is paid to the surviving spouse.
#2 A parent dies and super is paid to children under 18 (directly or via arrangements that still treat them as dependants)
2. Distributions to a Non-tax Dependant (see table above):
– Outcome: the tax-free component stays tax-free. Tax may apply to the taxable component.
– Common examples:
#1 Tax-free component: your after-tax / non-concessional contributions made over the years, when paid as a lump sum.
#2 Taxable component – taxed element:
a) Your employer’s contributions via the Super Guarantee Contributions.
b) Your salary sacrifice and personal deductible contributions (i.e. before tax contributions).
c) Investment earnings and growth inside the fund.
#3 Taxable component – untaxed element:
a) Certain public sector/government super schemes.
b) Sometimes where a death benefit includes insurance proceeds paid through super (this is fund-specific).
The good news? Your super fund can confirm your current component split (tax-free vs taxable), and whether there is any taxed and/or untaxed element recorded. You can also ask whether an insurance payout through super could affect the split on death. You just need to ask. If you have a Self-Managed Super Fund (SMSF), ask your accountant or SMSF administrator and they should be able to assist you.

ChatGPT: Giving it a dose of steroids
We all know how much ChatGPT likes to please us; give us further suggestions and further tasks it can do for us. Sometimes, however, less is more.
Here are some tips to get it working for you rather than you doing too much additional vetting and reading.
First, the negative prompt
To avoid the gratuitous ‘aiming to please’, one clever bunny came up with the following prompt and shortcut (it’s an unusual shortcut, unlikely to be used in your normal work; in this writer’s example, he used ‘potato’ as the one-word prompt).
Whenever I type the word “Potato:” followed by an idea or argument, ignore your “helpful” persona. Act as a hostile critic whose only job is to find holes in my logic.
1) Three specific ways my idea could fail
2) Two assumptions I’m making without proof
3) One strong counter-argument I haven’t addressed
Be precise. No fluff. No pep talk.
Then you write:
Potato: I should refinance now because rates might rise again.
This works well because it forces ChatGPT to stop “polishing” your idea and start stress-testing it.
Now for some positive prompts
I sourced these from ChatGPT while writing the above article summary.
But first, ChatGPT’s quick tip:
Tell ChatGPT what “good” looks like.
Example:
Use Australian English for Year 9 and 10. Keep it under 200 words. Include 3 sources. Show the strongest counterpoint.
That single habit cuts down the “trying to please” tone and lifts the usefulness fast.
#1 Research
Research this topic and give me:
– 5–8 key facts with citations (include publication date)
– What’s changed in the last 3–6 months
– 3 reputable sources I should read next
If evidence is thin, say “I don’t know” and tell me what to verify.
#2 Separate facts from assumptions
Answer in two sections:
A) What we know (verifiable facts)
B) What we’re assuming (and how to test it)
Keep it tight and practical.
#3 Give me trade-offs, not a single best
Give me 3 options with pros/cons and the best-fit scenario for each.
Then recommend one, with the key risk and what would change your recommendation.
#4 No fluff mode
Be direct. No motivational language.
If I’m wrong, say so plainly and explain why.
Use short bullets and concrete next steps.
#5 Quality control/self check
Before you finalise, do a quick self-audit:
– Any missing assumptions?
– Any likely errors or outdated claims?
– What would a sceptic challenge first?
Then revise the answer.