This is a property-heavy newsletter this month – a lot of data has been circulating in my inbox which is worth sharing with you. Plus, an interesting final segue to the Battle of the Currents. Talk about history repeats! (sorry Split Enz, it does).
Enjoy, share, and hit reply if anything sparks a question.
- Best interest rates – Owners and Investors
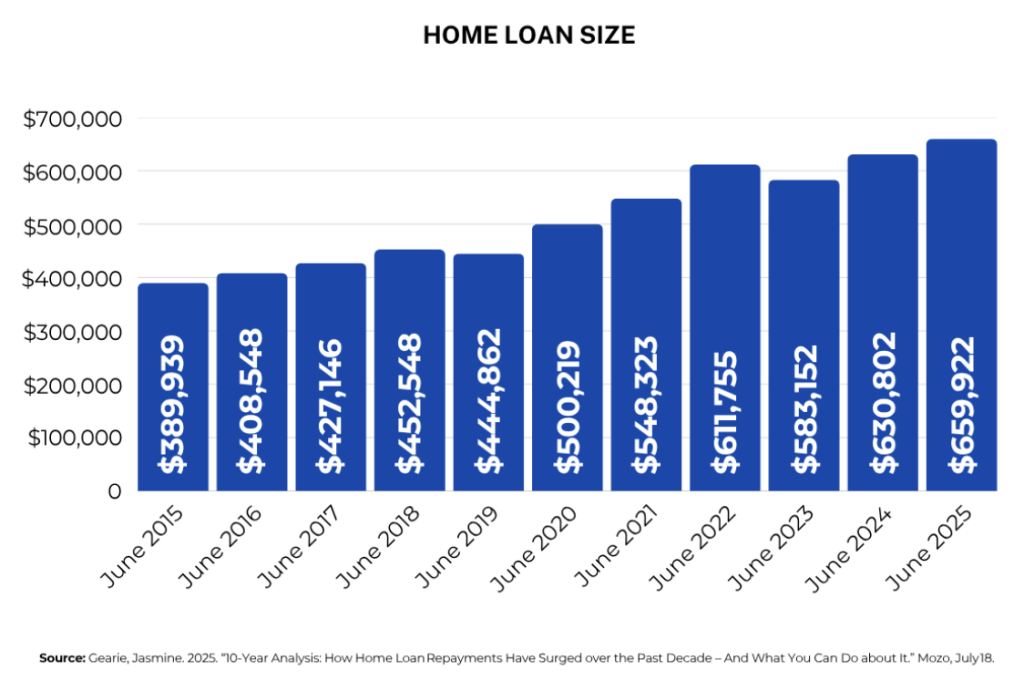
- Average home loan up 69% — So have the savings from refinancing
- More young buyers set to benefit from expanded Low-Deposit Scheme
- Buy-Vs-Rent: research reveals where it’s cheaper to buy than rent
- Buying? New-home sales hit a three-year high
- Selling? How to win this spring
- Investing in charities – it’s good for your soul
- Where should you invest next? Bustling metro or booming regional?
- Are NDIS investment properties still worth a look?
- Vacant rental? Why landlord insurance still matters
- Feasibility First – Why smart developers start with the numbers
- EVs no longer out of reach as prices and borrowing costs drop
- Energy wars – then and now – from the ‘Battle of the Currents’ in the 1880s to today’s battles for renewables
Read more below.
Best Interest Rates

The interest rates below are current as at 4 August 2025.
Overview:
- With over 3,500 loan products offered by 72 lenders, we have crunched the data to give you the ‘best of the best’ interest rates.
- The most recent RBA Cash Rate change was the 0.25% decrease in May 2025 which was preceded by a 0.25% decrease in February.
- There was no reduction at the RBA’s July Board meeting. The next RBA Board meeting is in August.
- With the recent disclosure of lower inflation and the USA tariff battle settling down, many commentators are predicting a decrease of 0.25% in August. They were confident in July but these two factors increase the likelihood of a further rate reduction in August.
- The RBA has flagged that inflation is likely to stay in the range of 2% to 3%.
- If inflation stays in this band, further rate reductions are likely.
What's excluded from our interest rates analysis:
- Clean energy rates (unless quoted) > first home buyer rates > packages > construction loan rates > offset account feature.
Loan assumptions:
- 30 year loan with a Loan to Value Ratio (LVR) of less than 60%.
- Interest Only rates are based upon an Interest Only period of 1 year.
- Fees and charges are excluded from consideration.
- Changes reflect changes from the prior month
Does your loan not start with a mid-5?
Owner Occupiers
Principal and Interest:
- Variable Rates: from 5.49% pa; no change
- Fixed Rates: from 4.99% pa 2 years; down by 0.1%
- Clean energy loans:
- – Variable Rates from 5.18% pa; no change
- – Fixed Rates from 4.74% 3 years down by 0.20%
Interest Only:
- Variable Rates: from 5.69% pa; no change
- Fixed Rates: from 5.29% pa – 2 years; down by 0.06%
Investors
Principal and Interest:
- Variable Rates: from 5.69% pa; no change
- Fixed Rates: from 5.15% pa 2 years; down by 0.04%
- Clean energy loans:
- – Variable Rates from 5.34% pa; no change
- – Fixed Rate loans from 5.04% pa 3 years with new build; down by 0.10%
Interest Only:
- Variable Rates: from 5.74% pa; down by 0.15%
- Fixed Rates: from 5.29% pa – 2 years; no change


Best Interest Rates
Average monthly repayments have climbed from $2,214 in June 2015 to $4,383 today, driven by bigger loan sizes and higher rates.¹
The good news? Swapping a typical rate for one of the sharpest on the market could now save up to $373 a month — more than $4,400 in the first year alone.²
Why it matters to you
Every extra dollar in interest is a dollar you could be using to build wealth elsewhere.
Many banks keep loyal customers on old (higher) rates after cuts. A quick loan review can expose hidden savings.
Quick next step
Book a 15-minute “Rate Health Check” — no forms, no fuss, just answers.
Sources: ¹Australian Bureau of Statistics, Mozo analysis (Aug 2025). ²Mozo home-loan comparison.

More young buyers set to benefit from expanded low-deposit scheme
As reported by The Holy Grail’s Australian Property Update, which is prepared by Terry Ryder, first-home momentum is building. Lenders issued 125,036 FHB loans in the year to March, up 3.8 % despite rising prices.
Queensland even grew its FHB share from 6.5 % to 6.9 % as buyers chased relative affordability and confidence.
Struggling to reach a 20% deposit?
If you know someone who is struggling to reach a 20 % deposit, there is some good news. From 1 July 2025, the federal Home Guarantee Scheme will offer 50,000 new places. Here are the details:
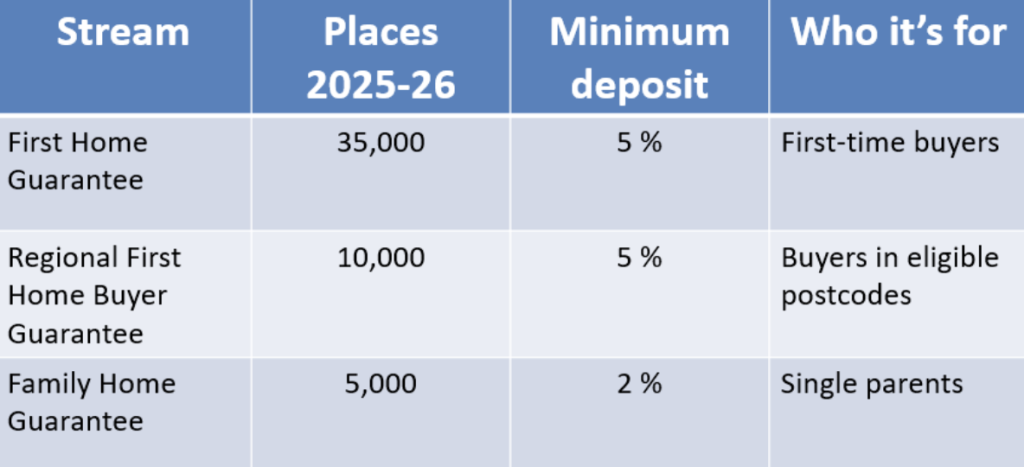
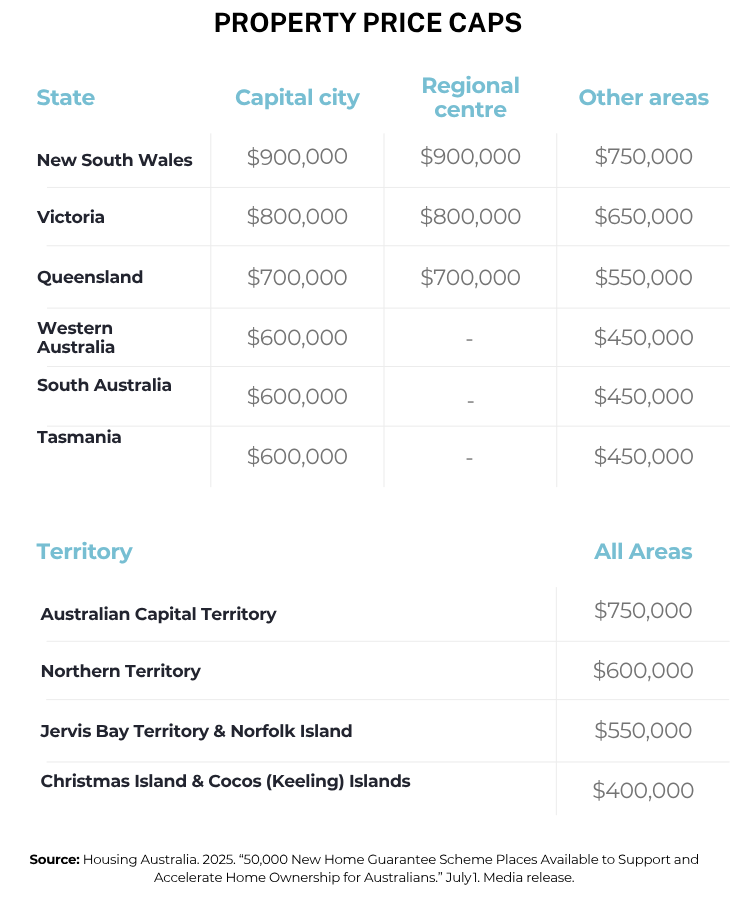
This could be your chance to fast-track your move from renting to owning — even if you haven’t reached that 20% deposit milestone yet.
The scheme has already helped over 230,000 Australians step into the market. If you’re keen to explore whether you qualify, reach out and I can help you understand the criteria and get started with the process.
Could you qualify?
Reply “Scheme” with your suburb and deposit saved, and I’ll send a two-minute checklist.

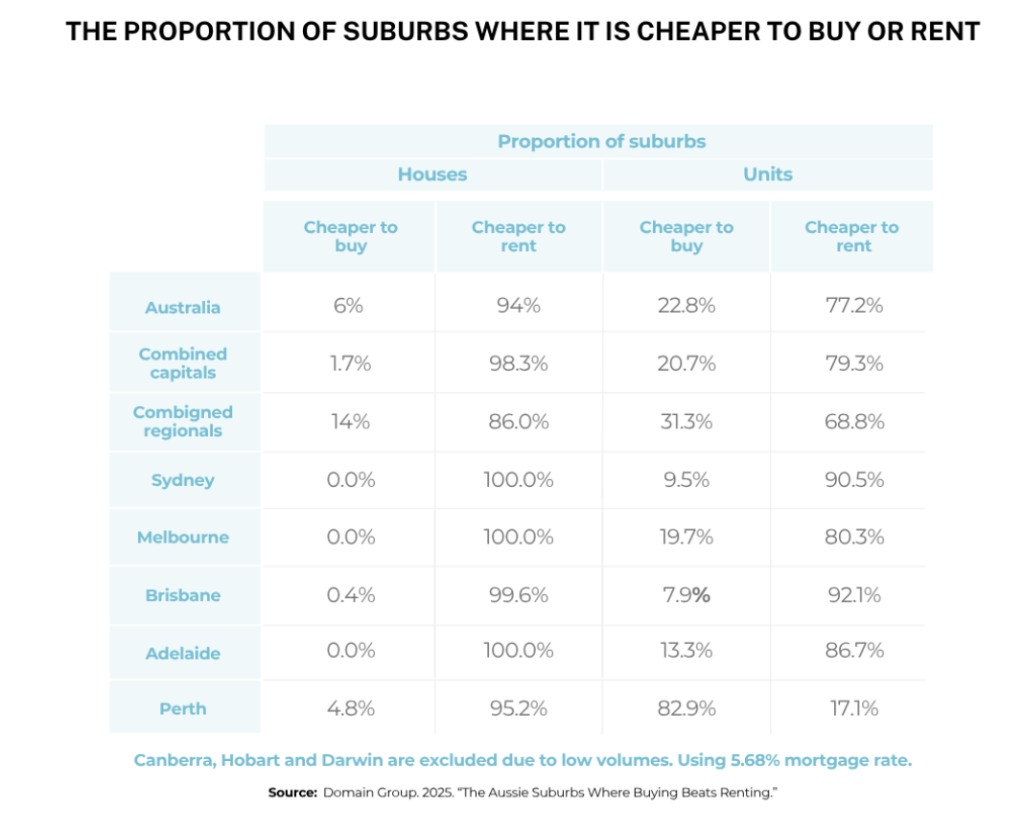
Research reveals where it’s cheaper to buy than rent
As reported by The Holy Grail, rental headwinds are easing: national rent growth slowed from 1.7 % in Q1 to 1.3 % in Q2 — the gentlest June-quarter rise since 2020
Vacancies remain tight at 1.6 %, yet the sharpest 12-month rent jumps are now in the smaller capitals: Darwin 6.2 %, Hobart 5.3 %, Perth 4.9 %.
In Sydney, buyer turnout at open homes held firm through the normally quiet July period, and clearance rates stayed “surprisingly steady” despite lower winter auction volumes.
Meanwhile, Domain’s latest crunch of house-and-unit data shows just 6.3% of capital-city suburbs make buying a house cheaper than renting.³ For units, it’s 14.5 %. With the regional markets, 27.3% of houses were found to favour buyers, and for units, 44.3% of houses were cheaper than renting.
But…
the bargains are disappearing.
Two reasons owning can still win:
- Security: Say goodbye to yearly rent hikes and lease worries. Rents, while slowing still outpace wages in many pockets.
- Potential growth: Equity rises with every repayment and any capital gains. And, in many affordable suburbs (< $700 k) are posting double-digit capital growth.
The suburb with the biggest gap in favour of buying a house was Baynton in Western Australia, where the weekly cost to own a house was $680 less than renting, while for units, Port Hedland (WA) led the way, with a weekly saving of $430 for owners over renters
Domain’s data highlights that buyers are more likely to find value in regional areas and the unit market than in capital city houses.
Not sure what you could borrow?
Let’s run the numbers. A five-minute call today could save months of guesswork.
Source: ³Domain Rent vs Buy Report, July 2025.

Buying or Selling?
Buying: New-home sales hit a three-year high
Let’s run the numbers. A five-minute call today could save months of guesswork.
State standouts: Victoria +27.7 %, Queensland +26.2 %, WA +11.3 %.
Builders face rising costs (up to 6 % in Brisbane for 2025) but buyer demand and looming infrastructure spends continues to pull projects forward.
Need a deeper dive or a quick borrowing-power check?
Hit reply and I’ll get back to you personally.
Selling: How to win this Spring
Guest insights from Kathryn Fantov, Director, Sydney Vendor Advocates.
Winter wrap-up: buyers didn’t hibernate
Despite the usual mid-year dip in auction numbers, July saw solid clearance rates and strong open-home turnout across many Sydney suburbs. The interest-rate cut earlier this year has rekindled confidence, with motivated buyers making competitive offers on well-presented family homes.
Key takeaway
Even in the cooler months, well-priced, well-presented stock is finding eager buyers.
Spring is coming – and competition with it
Spring always brings a surge in listings, which means your property must stand out. Kathryn says three factors make the biggest difference:
- Pricing precision – set a figure that attracts, not repels, serious buyers.
- Presentation – invest in professional styling, gardens and maintenance.
- Marketing strategy – maximise reach with the right mix of online portals, social media and quality photography.
Get these right and you’ll thrive even when “more homes for sale means buyers have options — and sellers need to be strategic.”
Ready to list?
As you know, I am a big fan of Vendor and Buyer Advocates. They are the professionals in the real estate game who are acting in your best interests.
If you would like to chat with a reputable Vendor Advocate, like Kathryn, just reach out.

Investing in charities
Investing in a good charity is good for your soul
and will make you a wealthy person on the inside
I have come across a few charities – not quite mainstream, but nonetheless, they fight the good fight.
We donate $100 with every loan settled. It’s a small reminder for us that what we do counts, but what we do can also help others.
What they do?
Have a look at their websites – and if you feel inclined, join the good fight
Women of Oz: look out for women who have been the subject of some form of abuse and they desperately need assistance – a car, a safe environment and legal support.
Destiny Rescue: rescuing children from sexual exploitation, both in Australia and overseas.
Orange Sky: Free laundry, showers and genuine chats for the homeless
Where should you invest next?
From a conversation with Glen Newbery, Property Investment Advisor, Suburbanite.
Metro markets:
Steady growth, lean yields.
Per Cotality (formerly CoreLogic), capital-city homes still dominate for long-term capital gains. Over the 12 months to April (latest full-year data), the combined capitals rose 6.4 %.
Rents are climbing too, yet high purchase prices keep returns tight; apartments in Sydney average 4.6 % gross yield while houses sit nearer 2-3 %.
Pros
- Deep jobs base, big-ticket infrastructure, diverse tenants.
- Lower vacancy risk (capital-city average ≈ 1.6 %).
- Historically smoother price cycles.
Cons
- Lower cash flow: median capital-city yield ≈ 3.5 %.
- Larger deposit & land-tax exposure.
- From the ABS, net internal migration is still leaking people from Sydney and Melbourne (-41 k & -7.6 k in 2023-24).
Regional play:
Punchy rents, bumpier cycles.
Cotality’s regional index rocketed 13 % in the same 12-month window—double the capitals’ pace.
Rents have run even harder: 4.1 % quarterly lift versus 2.9 % in the capitals at last check. That income translates to higher yields: vacant-house hotspots such as Broken Hill and Scottville are pulling 9–13 % returns.
Pros
- Gross yields around 4.4 % on average, often cash-flow positive.
- Lower entry prices (< $500 k still common).
- Per ABS, regional Australia added 113,800 residents (+1.3 %) in 2023-24.
Cons
- Price cycles can be sharper and tied to single industries (mining, tourism).
- Smaller rental pools: one big employer closing can spike vacancy.
- Limited land-tax thresholds in some states.
What's your objectives?
- Equity growth over 10+ yrs: Lean toward Metro inner or middle ring suburbs with their larger buyer base and resilient demand drivers.
- Immediate cashflow: Regional hubs with diversified economies due to their higher yields and lower buy-in costs.
- Balanced ‘set and forget’: Metro fringe or major regionals (eg Geelong and Sunshine Coast) due to reasonable yields and long term growth potential.
But remember: this is NOT advice. Always seek professional guidance and help before you act.
Take-aways:
- Start with your goal in mind: —growth vs cash flow—then stress-test the numbers:
- Target yield that keeps the property at least neutrally geared.
- Vacancy buffer (factor two months per year for smaller towns).
- Exit story: who’s buying from you in five or ten years?
Need help crunching suburb-level data or mapping rental demand? Let me put you in touch with those property investment advisors, such as Glenn.
Affordable suburbs are the real growth engine
National “5 % growth” headlines hide the real story. As reported by The Holy Grail, an analysis of 4,500 house/unit markets found 1,700 locations jumped ≥ 10 % last year, and 572 markets cracked 20 %.
Two-thirds of these high-growth areas still have medians below $700 k, proving affordability can equal performance. Queensland (664 suburbs) and Western Australia (397) led the charge, while units made up 200 of the star performers.
Take-away
Smart investors drill down to local drivers—jobs, infrastructure, sales turnover—rather than accept national averages.
Are NDIS investment properties still worth a look?
Insights from Mark Heritage, Invest Logic.
Many investors hear “SDA” (Specialist Disability Accommodation) for the Supported Independent Living (SIL) sector of the NDIS and think vacant houses and over-hyped yields. Mark Heritage says that’s the wrong end of the telescope. When you start with real participant demand and design to those care plans, the numbers can still stack up.
What works:
- Demand first: run an Expression-of-Interest drive before buying land.
- Design to need: wider hallways, height-adjustable benches, smart-home tech.
- Specialist team: provider + accredited builder = fewer compliance headaches.
- Multiple programs: homes that also suit TAC or aged-care clients cut vacancy risk.
Outcome: higher, stickier rents backed by 20-year NDIS funding.
“Too many SDA properties are empty because they were built backwards—we reverse-engineer from participant demand,” says Mark.
Keen to learn more?
Grab Mark’s due-diligence checklist (just reply NDIS) or call us for finance options.
And over the next couple of weeks, we will add a more detailed version to our blogs!

Vacant rental? Why landlord insurance still matters?
Summary of an email from Tuan Duong (Duo Tax), drawing on Duo Insurance’s article “Vacant Property Landlord Insurance Guide.”
On Census night 2021, there were around 25.4 million people in Australia and they lived in around 10.85 million dwellings. About 3.0 million of these dwellings were rented.
A dark, empty house can invite more than dust.
On Census night 2021, there were around 25.4 million people in Australia and they lived in around 10.85 million dwellings. About 3.0 million of these dwellings were rented.
Yet, across all dwellings,
a staggering 1.04 million were not occupied on this night.
That’s around 9.6% of vacant or unoccupied properties.
Insurance companies will tell you that an unoccupied property is ripe for theft, vandalism, arson and weather damage – plus more.
So guess what? Insurers will either not provide automatic and indefinite coverage if you decide to leave your property unoccupied – or, they will increase the excess you pay.
With your rental property’s landlord insurance, it usually stops coverage for both building and contents once the vacancy limit is exceeded (which is normally 30 to 60 vacant days without an occupant in the property).
So if you have a rental property,
an empty property doesn’t just mean “no rent coming in”;
it can also mean no insurance cover if you leave things as-is.
Vacant vs Unoccupied—know the jargon
- Vacant = no furnishings, no tenants (e.g. post-renovation).
- Unoccupied = furnished but unused (e.g. holiday home between guests).
Insurers price and limit cover differently for each, so mislabelling your property on your insurance policy application form can void a claim.
Why specialist “vacant-property” insurance exists
- Theft, vandalism and arson protection beyond the usual 30-day gap.
- Liability cover if someone’s hurt on site (think tradies during a reno).
- Rental-income replacement while repairs are underway.
Premiums are typically “a small extra monthly cost” compared with the five- or six-figure hit a claim could save.
Checklist before you call your insurer
- Confirm vacancy status and expected timeframe.
- Install basic security (locks, alarms, regular inspections).
- Ask for a vacancy endorsement or a dedicated vacant-home policy.
- Have a good insurance broker who does the hard yards for you.
- If you don’t have a good insurance broker, READ THE POLICY!!!
“Don’t let an avoidable insurance oversight turn into a six-figure lesson,” Tuan writes. Get the right cover before the letterbox overflows and the vandals move in.
Need a good insurance broker? Tuan can help you, or just reply, and I will set you up with an intro.

Feasibility first: Why smart developers start with the numbers?
Before a shovel hits the ground, a robust feasibility study—under-pinned by hard demographic data—can spell the difference between a project that hums for decades and one that limps from day one.
Dr Muthu Pannirselvam, Director at Project Space – is an educator with a strong academic background. He has progressively moved into the real estate industry where he has found a niche in the investment property education and feasibility assessment space.
In the following three examples, Muthu illustrates how data-led due diligence steers everything from medical centres to mobility hubs.
1. South East health precinct – matching services to ageing demand
A desktop scan of GP registers showed only 12 doctors servicing four clinics. Census projections flagged steady population growth and rising disability-support needs in the catchment.
Those figures helped a developer justify a larger consulting-suite footprint and additional accessible parking—decisions that lift both community utility and long-term rental income.
2. Mornington Peninsula infill project – aligning stock with local wallets
In a coastal town on the Mornington Peninsular, median house prices sit at $1.2 million with 19.4 % annual growth, but yields hover at just 2.45 %. The predominant age bracket is 60–69 and 72 % of homes are owner-occupied.
Armed with that mix of price appreciation and retiree demographics, one developer pivoted from high-density apartments to larger, single-level town-houses aimed at downsizers—trading quicker resale velocity for slightly lower gross yield.
3. Future truck-stop / mobility hub – sizing a new revenue model
Australia now fields 6,500 service stations for 25 million people (one site per ~3,900 residents)—down from 25,000 outlets in 1973. Yet road freight keeps growing: 460,000 registered trucks travelling an 850,000 km road network.
SuprXr’s feasibility mapped those trends against charging-dwell times (30–60 minutes for electric trucks) and proved that future “mobility hubs” will need larger footprints for retail tenancies. Convenience stores already deliver ~70 % of site profit vs 30 % from fuel.
Without that granular traffic and profit-source modelling, a new-build hub could easily under-spec its power supply or over-invest in dispensers that never pay their way.
Five take-aways for developers
- Map supply-and-demand gaps early – doctor ratios, dwell times, price-to-rent spreads and traffic counts expose unmet needs.
- Segment by demographics – age, income, household type and commuting patterns dictate product mix and amenities.
- Stress-test revenue lanes – in fuel retail, café and convenience margins may eclipse pump sales; in retirement hot-spots, strata fees matter as much as sale price.
- Model multiple futures – EV uptake, population ageing and zoning changes can swing feasibility by double digits.
- Document assumptions – lenders and JV partners now expect transparent data sources (ABS, AIHW, traffic counts) before they unlock capital.
Need help crunching the data for your next project? Reply “Feasibility” and we’ll set up a complimentary scoping call.


EVs no longer out of reach as prices and borrowing costs drop
More sub-$60k models and green-loan discounts mean switching to an EV is no longer just for early adopters. Add in lower running costs (especially if you charge at home) and the total cost of ownership can beat many petrol cars.
For used EVs, the myths keep being busted! Auction house Pickles now publish battery health scores for its EVs with detailed battery certificates with each tested EV sold. What Pickles found when they tested the battery health of a used EV (battery health percentages reflect the storage capacity compared to when it rolled off the production line).
- 20,000 to 40,000 km: ~96%
- 40,000 to 80,000: 95%
- 80,000 to 120,000: 91%
- Over 120,000: 83% (this is across many of the early models and which had far more than 120,000 on the clock)
- More than 4 years old: 94%
And in China, the fresh battlefront is not about how long your car can drive on a single charge but how fast you can refill its battery. The records keep tumbling and the infrastructure required will need to be built – but the numbers are getting super-impressive and I think The Carpenters nailed it when they sang ‘We’ve only just begun’!
Finance perks on offer
- Interest-rate discounts of up to 1 % on dedicated EV loans
- Longer terms or balloon options to keep monthly repayments down
- Fringe Benefits Tax savings for eligible novated leases
Thinking electric?
Taking your cash to a dealer will enable you to negotiate a better deal.
Ask me what might be your best deal before you hit the dealership.
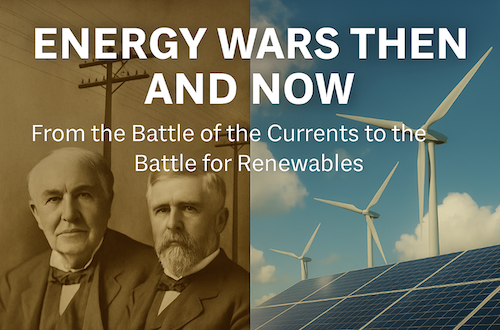
Energy Wars Then and Now: From the battle of the Currents to the battle for Renewables
This article was inspired by a recent article by Darren Wilson, in an edition of Property Sharemarket Economics. They are among my favourite teachers!
As we weigh up green-loan discounts for electric cars and debate whether solar, wind, nuclear or old-school fossil fuels should power the world’s future, it is no surprise to learn that energy fights are nothing new. Long before lithium-ion batteries and net-zero targets, Thomas Edison, Nikola Tesla and George Westinghouse waged their own “current war” over which type of electricity—direct current (DC) or alternating current (AC), would light the world.
Their high-stakes showdown not only settled that question but paved the way for every gadget (and every EV) we charge today. Here’s the short story of how practicality ultimately flipped the switch..
How the AC/DC truce looks today
The mains power that reaches your wall socket is almost entirely AC, stepped down to 230 volts in Australia after travelling vast distances on high-voltage ‘super highway’ transmission lines at up to 500 kilo volts (i.e. 2.,200 times higher than your home!).
As a bit of tecchie detail this ‘step-down’ in power voltage looks a bit like this:
high-voltage transmission (500 kV → 275/330 kV) ➜ sub-transmission zone (132 kV, 66 kV, 33 kV) ➜ distribution ((22 kV, 11 kV, occasionally 6.6 kV) ➜ street-level transformers (trim that down to 400V ‘three phase’/ 230V ‘single phase’) ➜ 230 V in your home.
The devices you plug in—phones, laptops, solar panels, and the battery pack in an EV—actually run on DC. Tiny transformers in every charger (and inverters in rooftop solar systems) quietly convert the wall’s AC back to DC, proving that the “losing” current never disappeared; it just found a new role inside our modern gadgets.
A drama worthy of Hollywood
After inventing the practical incandescent bulb, Thomas Edison built small power stations that pushed low-voltage direct current (DC) through short city blocks. He wanted every street in America lit by his system—and controlled by his investors, including J. P. Morgan. Enter Nikola Tesla, a Serbian-born engineer who believed the future lay in alternating current (AC), a form of electricity that reverses direction dozens of times a second. AC could be sent hundreds of kilometres at high voltage, then reduced safely for homes—saving mountains of copper wire and money.
Tesla found a champion in George Westinghouse, a Pittsburgh industrialist who bought Tesla’s patents and bank-rolled full-scale AC experiments. Edison fought back with a fear campaign, staging public electrocutions of animals and supporting the first electric chair to paint AC as deadly. The contest reached its turning point in 1893 when Westinghouse and Tesla lit the Chicago World’s Fair with brilliant, flicker-free AC lamps. Twenty-seven million visitors saw, felt and trusted the new current.
Physics—and economics—finished the job.
Because AC could be “stepped up” for long-distance transmission and “stepped down” for household use, it made rural electrification possible and slashed infrastructure costs. By 1892 even Edison’s own company, merged into the newly formed General Electric, quietly adopted AC technology. Today, every powerpoint in your house owes more to Tesla’s maths and Westinghouse’s money than to Edison’s early showmanship.
Three lessons still ring true
First, big ideas need the right business model: Tesla’s genius required Westinghouse’s capital to win.
Second, scare campaigns fade while efficiency endures—AC was branded dangerous, yet its practicality prevailed.
Finally, even giants must pivot: Edison lost the current war but reshaped his ventures and left a culture of relentless experimentation that survives in modern R & D labs.
So next time you flick a switch, remember the long, messy battle that decided which current would power the modern world—and how, in the end, practicality lit the way.